
Best Areas to Invest in Istanbul 2026: Official Numbers Instead of District Lists
Central Bank and TÜİK data, the gap between nominal and real returns, and a six-criteria method you can apply yourself.

Istanbul's house price index rose 25.4% year on year (Central Bank, May 2026) while annual inflation ran at 32.11% (TÜİK, June 2026) — nationally, prices fell 6.1% in real terms. Istanbul rents rose 36.7%, outpacing prices. The practical implication: this market currently rewards a rental-income strategy over betting on capital appreciation.
| Indicator | Value and period |
|---|---|
| House prices — Istanbul (nominal) | +25.4% · May 2026 |
| House prices — Türkiye (real) | −6.1% · May 2026 |
| Rent index — Istanbul | +36.7% · May 2026 |
| Annual inflation | 32.11% · June 2026 |
| Istanbul sales | 24,084 (18.5%) · June 2026 |
| Istanbul share of foreign purchases | About 41.5% · June 2026 |
Financial content (YMYL). Every official figure is attributed with its reference period: Central Bank of the Republic of Türkiye (TCMB), Turkish Statistical Institute (TÜİK), Law No. 2644, and the 2026 Investment Programme published in the Official Gazette. Market-platform figures are labelled separately as market, not official. This is informational analysis, not personal investment advice.
Welcome — one number reframes the whole question
Almost everything written about "the best areas to invest in Istanbul" is a list of district names. We read the live English and Arabic results for this query in July 2026 and found one thing they all share: not a single number. No price per square metre, no yield, no mention of inflation.
That matters, because the first figure any buyer should see inverts the picture:
A 25% gain in a country with 32% inflation is not a profit. It is a loss written in attractive handwriting.
The official dashboard
| Indicator | Value | Period | Source |
|---|---|---|---|
| House price index — Türkiye (nominal) | +24.5% | May 2026 | TCMB |
| House price index — Türkiye (real) | −6.1% | May 2026 | TCMB |
| House price index — Istanbul (nominal) | +25.4% | May 2026 | TCMB |
| Rent index — Istanbul (nominal) | +36.7% | May 2026 | TCMB |
| Annual inflation | 32.11% | June 2026 | TÜİK |
| House sales — Türkiye | 129,979 (+15.8%) | June 2026 | TÜİK |
| House sales — Istanbul | 24,084 (18.5% of national) | June 2026 | TÜİK |
| Mortgaged sales | 25,993 (+72.1%) | June 2026 | TÜİK |
| Sales to foreigners — Türkiye | 2,015 (+20.1%) | June 2026 | TÜİK |
| Sales to foreigners — H1 | 9,083 (−9.2%) | Jan–Jun 2026 | TÜİK |
| Istanbul's share of foreign purchases | 837 (≈41.5%) | June 2026 | TÜİK |
| Leading buyer nationalities | Russia 381 · Ukraine 170 · Iran 170 | June 2026 | TÜİK |
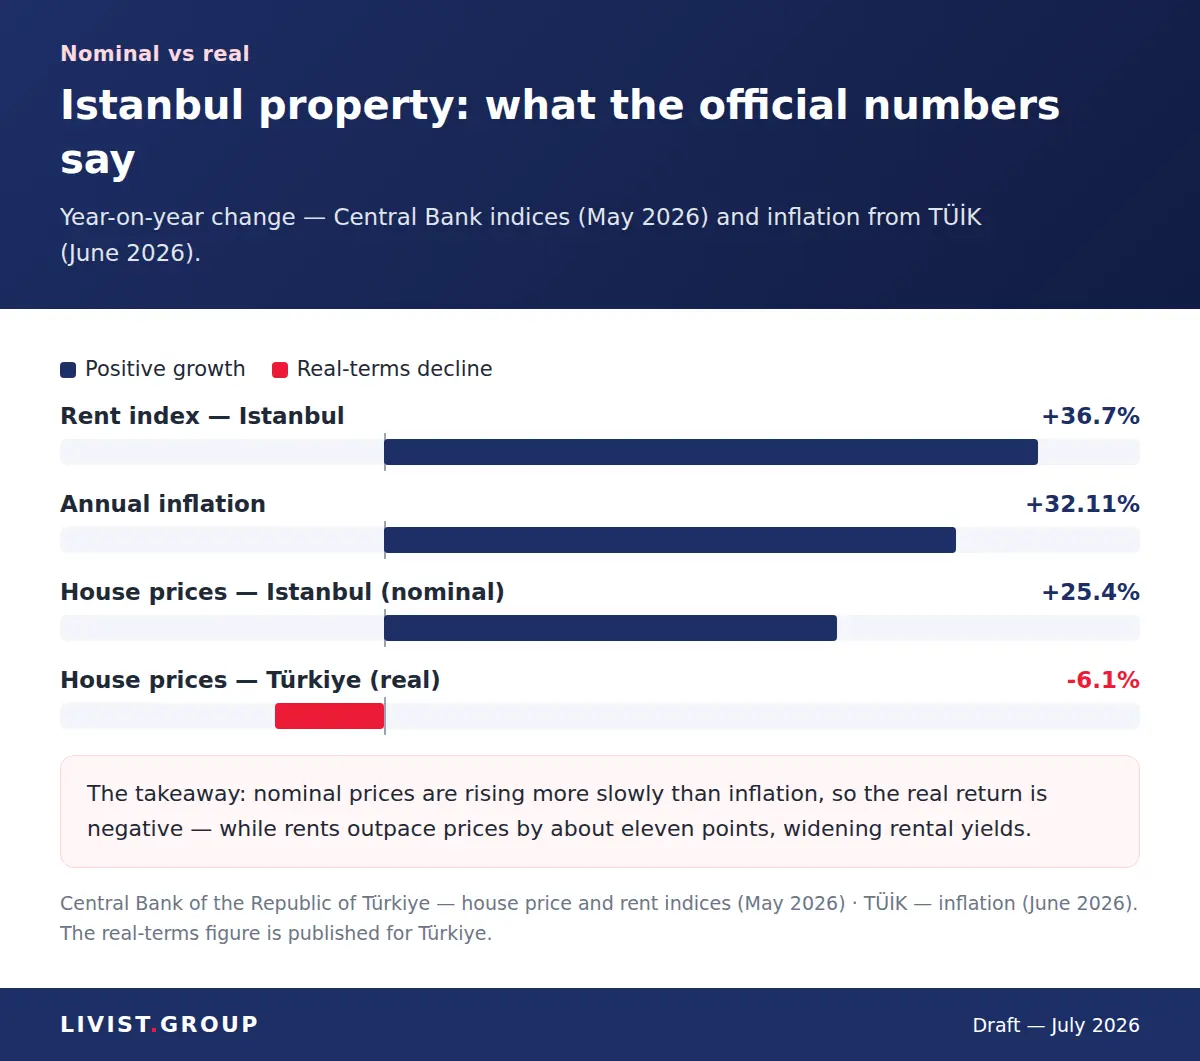
Nominal versus real returns in the Istanbul market, 2026 · Livist Group
What the numbers say together
Rents are outrunning prices. Istanbul's rent index rose 36.7% against 25.4% for prices — an eleven-point gap. Mechanically, that means yields are widening: you are buying an asset whose price growth has cooled and letting it into a rental market growing faster. Right now the market pays the income investor better than the speculator.
Domestic demand is shifting, not vanishing. Mortgaged sales up 72.1% in a single month signals financing returning, while cumulative sales remain 3.1% below last year. A market in motion, not a market on fire.
Foreign demand is down annually and up monthly. H1 is 9.2% lower, June alone is 20.1% higher. And Istanbul absorbs roughly 41.5% of all foreign purchases in Türkiye — it is not one option among cities; it is the market.
Why no two lists agree
When the "best district" changes with the language of the page rather than with the data, you are not reading analysis. You are reading an inventory list.
Instead of a list: six criteria
- Net yield, not gross. Deduct building fees (aidat), property tax, DASK and insurance, one month of vacancy, and maintenance. What remains is your actual return — usually two to three points below the figure in the sales deck.
- Depth of the local rental market. Ask who specifically rents this flat: a student, an office worker, a family? A district with no clear economic driver is a district with no stable tenant.
- Infrastructure that is finished, not announced. A metro line running today is worth multiples of one "under study". Paying today for tomorrow's pricing is the classic trap.
- Resale liquidity. How many identical units are listed in the same development right now? If you will compete with a hundred of them on exit, your price is not your price.
- Legal status. Title type, the district's foreign-ownership quota, restricted zones — see our tapu registration guide.
- Your measuring currency. Decide at the outset whether you measure in lira or in your home currency. Mixing the two is the single most common reason an investor believes they profited when they did not.
Three marketing claims that need a caveat
1. "Canal Istanbul will lift prices"
We checked the 2026 government Investment Programme published in the Official Gazette (15 January 2026, No. 33138), worth roughly 1.92 trillion lira. The project itself does not appear in it. The only related line is "Canal Istanbul connection roads", carrying a token allocation of 10,000 lira — a placeholder, not a construction budget. We found no recent official statement on commencement.
A project holding a 10,000-lira line in a trillion-lira programme is not a price driver. It is an open accounting entry.
This does not mean the project is cancelled. It means anyone pricing land on the assumption it proceeds is selling you a possibility at the price of a certainty.
2. "Guaranteed 10% yield"
No Turkish official body publishes rental yield figures at all — we verified this; it is a confirmed absence, not a gap in our research. The Central Bank publishes a rent index, which is a different thing. Every yield number you see comes from a market platform or the seller's own estimate. For orientation only, and explicitly labelled market, not official: platform data for May 2026 indicates an average Istanbul price near 63,000 TRY per square metre and a payback period of about thirteen years (roughly 7.7% gross, before costs). Treat it as a direction of travel, not a contractual number.
3. "Property protects you from inflation"
Sometimes true; not true at the moment. Official data show national house prices losing 6.1% in real terms over twelve months. Inflation protection is a hypothesis tested annually against the numbers, not a law of nature.
Citizenship by investment: the threshold and the valuation trap
The USD 400,000 threshold stands; the governing presidential decision was last amended on 12 December 2023, and we found no amendment after that as at this review. The recurring trap is the inflated valuation: a property worth less on the open market presented with a report that lands exactly on the threshold. You pay a premium you cannot recover on resale, and you risk rejection of the file. Detail in our Turkish citizenship through real estate guide.
Ownership limits, precisely
Under Article 35 of Law 2644: a foreign individual may hold up to 30 hectares, and foreign ownership may not exceed 10% of the privately-owned land within a district (İlçe). Note the double precision: the percentage is not measured against a neighbourhood, nor even against the district's total area, but against its privately-owned land. The article was not amended in 2025 or 2026.
Checklist before you buy
- Have you calculated the net yield after every cost?
- Have you compared nominal growth against inflation to find your real return?
- Do you know specifically who will rent your unit?
- Is the infrastructure you are pricing on operating today?
- How many comparable units are listed in the development right now?
- Does the valuation report reflect the market or the threshold?
- Have you checked the district quota and the title type?
- In which currency will you judge this investment in five years?
If the purchase is tied to relocating, review the closed neighbourhoods list and the residence permit guide before narrowing to one area.
Why Livist
We hold no inventory to move and keep no standing list of districts to repeat to every client. We start from your objective — monthly income, capital growth, or a citizenship route — and build the comparison in numbers: calculated net yield, resale liquidity, legal status, independent valuation. If the numbers do not support buying right now, we will say so.
Request a numbers-first analysis of your options — Livist Real EstateFrequently asked questions
Answers to the most common questions about this topic

Where to Live in Istanbul 2026: Neighbourhoods for Expats
Where to live in Istanbul comes down to two questions: which neighbourhood suits you, and which one will register your residence address at all.

Property Tax in Turkey 2026: Rates, Dates and Exemptions
Property tax in Turkey from Law 1319: the annual rates, the metropolitan doubling, the two instalments and compulsory earthquake cover.

Turkish Citizenship by Investment 2026: All Seven Routes, and Who Attests Each Amount
The full official list from the Investment Office — thresholds, three-year lock-ins and the ministry or regulator that must certify each one — plus how to check a title deed yourself before anyone’s paperwork.